The Property-Tax Gap 2026
Same state, different bill: what 3,125 county-level effective rates reveal about where homeowners pay 82× more.
Across 3,125 US counties, the effective property-tax rate a typical homeowner pays runs from 0.03% (Hoonah-Angoon Census Area, Alaska) to 2.47% (Camden County, New Jersey) — roughly a 82× spread. The gap does not stop at state lines: inside a single state it reaches 39× in Alaska and 8.2× in Texas. Median annual bills range from $207 in Choctaw County, Alabama to $10,000+ in 17 metro counties.
A 82× spread across America
0.03% in Hoonah-Angoon Census Area, Alaska vs 2.47% in Camden County, New Jersey. 42 counties sit at 2.00% or more; 105 are at 0.30% or less.
The gap lives inside states too
Alaska: 39×. Among the lower 48: Texas 8.2×, Tennessee 8.1×, Louisiana 6.5×. Crossing a county line can change the bill more than crossing a state line.
$207 a year — or $10,000+
The smallest median bill in America is $207 (Choctaw County, Alabama). 17 counties — NY/NJ metro above all — have median bills the Census can only report as “$10,000+”.
Brooklyn beats upstate New York
Kings County (Brooklyn) pays an effective 0.56% — while Monroe County (Rochester) pays 2.41%. New York City homeowners face a lower effective rate than much of upstate.
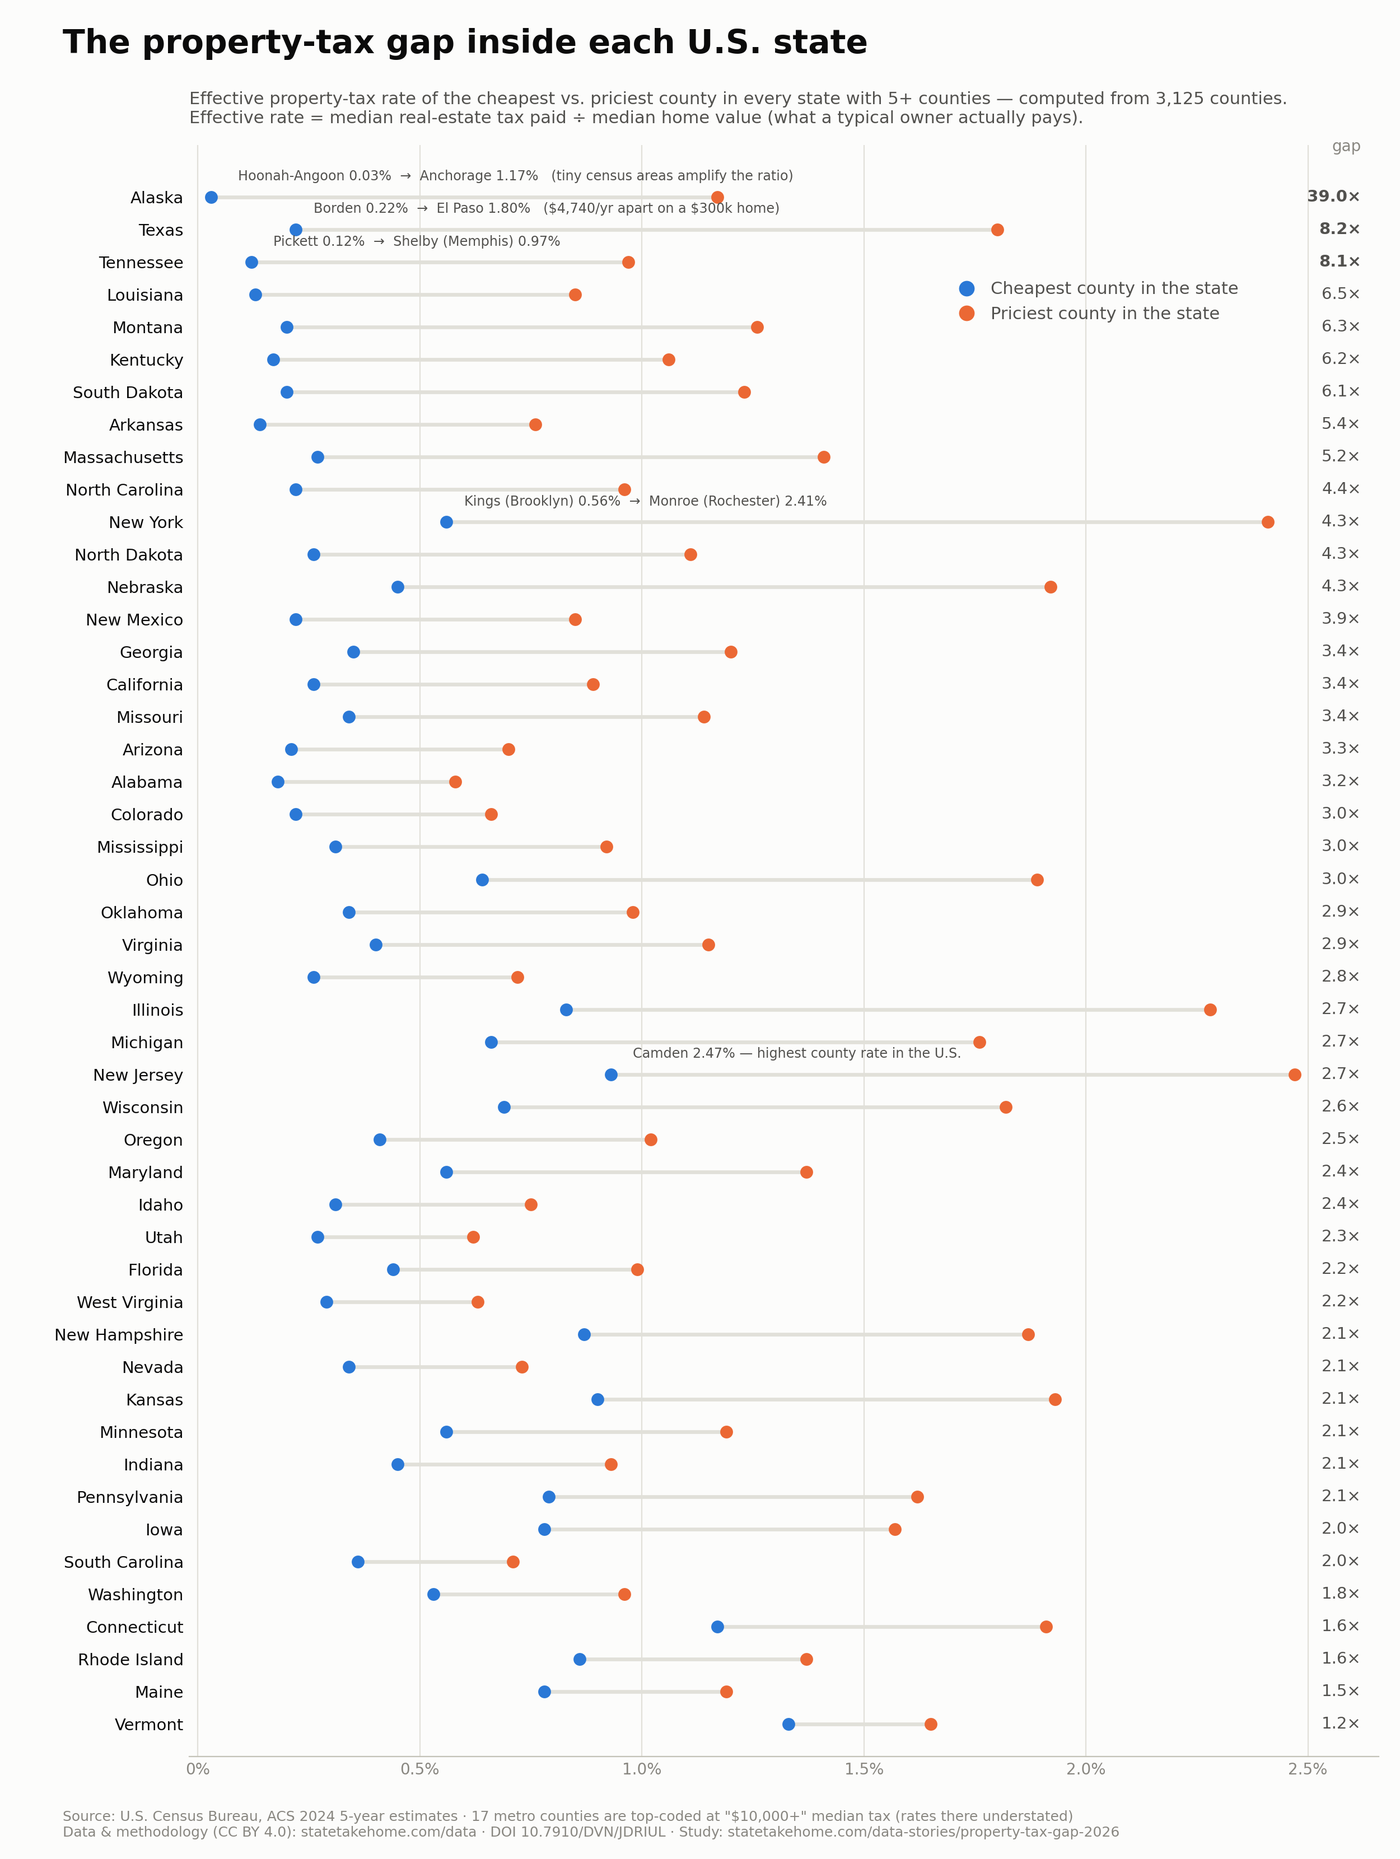
Which states have the widest county-to-county gap?
For every state with at least five counties in the data, the table shows its cheapest and priciest county by effective rate, the resulting ratio, and what that gap is worth per year on a $300,000 home.
| # | State | Cheapest county | Priciest county | Gap | On a $300k home |
|---|---|---|---|---|---|
| 1 | Alaska | Hoonah-Angoon Census Area 0.03% | Anchorage Municipality 1.17% | 39× | $3,420/yr |
| 2 | Texas | Borden County 0.22% | El Paso County 1.80% | 8.2× | $4,740/yr |
| 3 | Tennessee | Pickett County 0.12% | Shelby County 0.97% | 8.1× | $2,550/yr |
| 4 | Louisiana | St. Helena Parish 0.13% | Orleans Parish 0.85% | 6.5× | $2,160/yr |
| 5 | Montana | Carter County 0.20% | Liberty County 1.26% | 6.3× | $3,180/yr |
| 6 | Kentucky | Green County 0.17% | Campbell County 1.06% | 6.2× | $2,670/yr |
| 7 | South Dakota | Buffalo County 0.20% | Potter County 1.23% | 6.1× | $3,090/yr |
| 8 | Arkansas | Monroe County 0.14% | Phillips County 0.76% | 5.4× | $1,860/yr |
| 9 | Massachusetts | Nantucket County 0.27% | Hampden County 1.41% | 5.2× | $3,420/yr |
| 10 | North Carolina | Swain County 0.22% | Orange County 0.96% | 4.4× | $2,220/yr |
| 11 | Nebraska | Logan County 0.45% | Hayes County 1.92% | 4.3× | $4,410/yr |
| 12 | New York | Kings County 0.56% | Monroe County 2.41% | 4.3× | $5,550/yr |
| 13 | North Dakota | Sioux County 0.26% | Cass County 1.11% | 4.3× | $2,550/yr |
| 14 | New Mexico | Rio Arriba County 0.22% | Bernalillo County 0.85% | 3.9× | $1,890/yr |
| 15 | California | Trinity County 0.26% | Kern County 0.89% | 3.4× | $1,890/yr |
| 16 | Georgia | Towns County 0.35% | Dougherty County 1.20% | 3.4× | $2,550/yr |
| 17 | Missouri | Wright County 0.34% | St. Louis County 1.14% | 3.4× | $2,400/yr |
| 18 | Arizona | Apache County 0.21% | Pima County 0.70% | 3.3× | $1,470/yr |
| 19 | Alabama | Choctaw County 0.18% | Jefferson County 0.58% | 3.2× | $1,200/yr |
| 20 | Colorado | Jackson County 0.22% | Broomfield County 0.66% | 3× | $1,320/yr |
| 21 | Mississippi | Claiborne County 0.31% | Washington County 0.92% | 3× | $1,830/yr |
| 22 | Ohio | Noble County 0.64% | Cuyahoga County 1.89% | 3× | $3,750/yr |
| 23 | Oklahoma | Pushmataha County 0.34% | Tulsa County 0.98% | 2.9× | $1,920/yr |
| 24 | Virginia | Brunswick County 0.40% | Falls Church city 1.15% | 2.9× | $2,250/yr |
| 25 | Wyoming | Niobrara County 0.26% | Washakie County 0.72% | 2.8× | $1,380/yr |
| 26 | Illinois | Hardin County 0.83% | Winnebago County 2.28% | 2.7× | $4,350/yr |
| 27 | Michigan | Leelanau County 0.66% | Ingham County 1.76% | 2.7× | $3,300/yr |
| 28 | New Jersey | Cape May County 0.93% | Camden County 2.47% | 2.7× | $4,620/yr |
| 29 | Wisconsin | Vilas County 0.69% | Milwaukee County 1.82% | 2.6× | $3,390/yr |
| 30 | Oregon | Grant County 0.41% | Multnomah County 1.02% | 2.5× | $1,830/yr |
| 31 | Idaho | Clark County 0.31% | Nez Perce County 0.75% | 2.4× | $1,320/yr |
| 32 | Maryland | Talbot County 0.56% | Baltimore city 1.37% | 2.4× | $2,430/yr |
| 33 | Utah | Garfield County 0.27% | Emery County 0.62% | 2.3× | $1,050/yr |
| 34 | Florida | Holmes County 0.44% | Alachua County 0.99% | 2.2× | $1,650/yr |
| 35 | West Virginia | Calhoun County 0.29% | Kanawha County 0.63% | 2.2× | $1,020/yr |
| 36 | Indiana | Brown County 0.45% | Lake County 0.93% | 2.1× | $1,440/yr |
| 37 | Kansas | Washington County 0.90% | Comanche County 1.93% | 2.1× | $3,090/yr |
| 38 | Minnesota | Cass County 0.56% | Ramsey County 1.19% | 2.1× | $1,890/yr |
| 39 | Nevada | Eureka County 0.34% | Mineral County 0.73% | 2.1× | $1,170/yr |
| 40 | New Hampshire | Carroll County 0.87% | Cheshire County 1.87% | 2.1× | $3,000/yr |
| 41 | Pennsylvania | Bedford County 0.79% | Monroe County 1.62% | 2.1× | $2,490/yr |
| 42 | Iowa | Dickinson County 0.78% | Polk County 1.57% | 2× | $2,370/yr |
| 43 | South Carolina | Calhoun County 0.36% | Bamberg County 0.71% | 2× | $1,050/yr |
| 44 | Washington | San Juan County 0.53% | Garfield County 0.96% | 1.8× | $1,290/yr |
| 45 | Connecticut | Western Connecticut Planning Region 1.17% | Capitol Planning Region 1.91% | 1.6× | $2,220/yr |
| 46 | Rhode Island | Newport County 0.86% | Kent County 1.37% | 1.6× | $1,530/yr |
| 47 | Maine | Piscataquis County 0.78% | Androscoggin County 1.19% | 1.5× | $1,230/yr |
| 48 | Vermont | Grand Isle County 1.33% | Rutland County 1.65% | 1.2× | $960/yr |
Not ranked (fewer than five counties): Delaware (3), Hawaii (4). Alaska's 39× ratio is amplified by very small census areas such as Hoonah-Angoon Census Area; the lower-48 leaders are a fairer picture of what most homeowners can encounter.
Why does the same state bill some homeowners 8× more?
Statutory rates are only the surface. The effective rate a homeowner actually pays combines local millage, assessment ratios, homestead exemptions and assessment caps — all set at county or municipal level. In Texas, Borden County homeowners pay a median 0.22% while El Paso County pays 1.80%: on a $300,000 home, that is a $4,740-per-year difference without leaving the state. School funding formulas and the share of revenue raised from sales or income taxes explain most of the rest.
The New York paradox makes the mechanism visible: New York City applies assessment limits to residential class 1 property, so Kings County's effective rate (0.56%) lands below many upstate counties, where full-value assessment pushes Monroe County to 2.41% — on far cheaper homes.
Explore any county in the interactive tables of our property tax by state comparator, or drill into flagship counties like Cook County, IL, Harris County, TX and Santa Clara County, CA.
Methodology & data
- Source: US Census Bureau, American Community Survey (ACS) 2024 5-year estimates — median real-estate taxes paid and median owner-occupied home value, for 3,125 counties and county-equivalents.
- Effective rate = median tax paid ÷ median home value. It reflects what a typical owner actually pays, not the statutory millage.
- Top-coding disclosure: ACS caps median tax paid at $10,000. In the 17 counties at the cap, true medians are at least $10,000 and effective rates are conservative (understated).
- Counties with suppressed or zero values are excluded from ratio rankings.
- Full dataset (state, county, effective rate, median value, median tax): CSV download — CC BY 4.0. Citable mirrors: DOI 10.7910/DVN/JDRIUL (Harvard Dataverse) and 10.5281/zenodo.21244037 (Zenodo).
Cite this study
Journalists and researchers are welcome to reuse any figure or the full dataset with attribution: “StateTakeHome, The Property-Tax Gap 2026 — statetakehome.com/data”. For questions about the data or custom county cuts, write to contact@statetakehome.com — we answer fast and can provide state-specific breakdowns on request. See also our general methodology and the open-data catalog.
Frequently asked questions
Hoonah-Angoon Census Area, Alaska, at an effective rate of 0.03% of median home value — the lowest of the 3,125 counties in our dataset. The highest is Camden County, New Jersey, at 2.47%.
Alaska: Hoonah-Angoon Census Area pays an effective 0.03% while Anchorage Municipality pays 1.17% — a 39× spread inside one state (note that Alaska's low-population census areas amplify the ratio). Among the lower 48, Texas leads at 8.2× (Borden County vs El Paso County).
The smallest median annual bill is $207 in Choctaw County, Alabama. At the other end, 17 counties — mostly in the New York and New Jersey metro areas — have median bills of $10,000 or more (the Census Bureau top-codes this variable at $10,000, so the true medians there are at least that high).
For each of the 3,125 counties we divide the median real-estate tax paid by the median owner-occupied home value, both from the US Census Bureau's American Community Survey 2024 5-year estimates. This yields the effective rate a typical homeowner actually pays, which can differ from statutory millage rates because of assessment ratios, homestead exemptions and caps.
Yes — the full 3,125-county table (state, county, effective rate, median home value, median tax paid) is free to download as CSV under a CC BY 4.0 license, with a citable DOI on Harvard Dataverse and Zenodo. Attribution: “StateTakeHome, https://statetakehome.com/data”.
StateTakeHome provides pricing and market research about taxes, not tax, legal or financial advice. Figures are 2026-vintage medians from public sources; individual bills depend on assessment, exemptions and local budgets. Verify with your county assessor before making decisions.